The ATW Market Depth Indicator brings institutional-grade volume footprint analysis to TradingView. See exactly where buyers and sellers are positioned at every price level.
Most traders only see price. The ATW Market Depth Indicator shows you the orders driving that price.
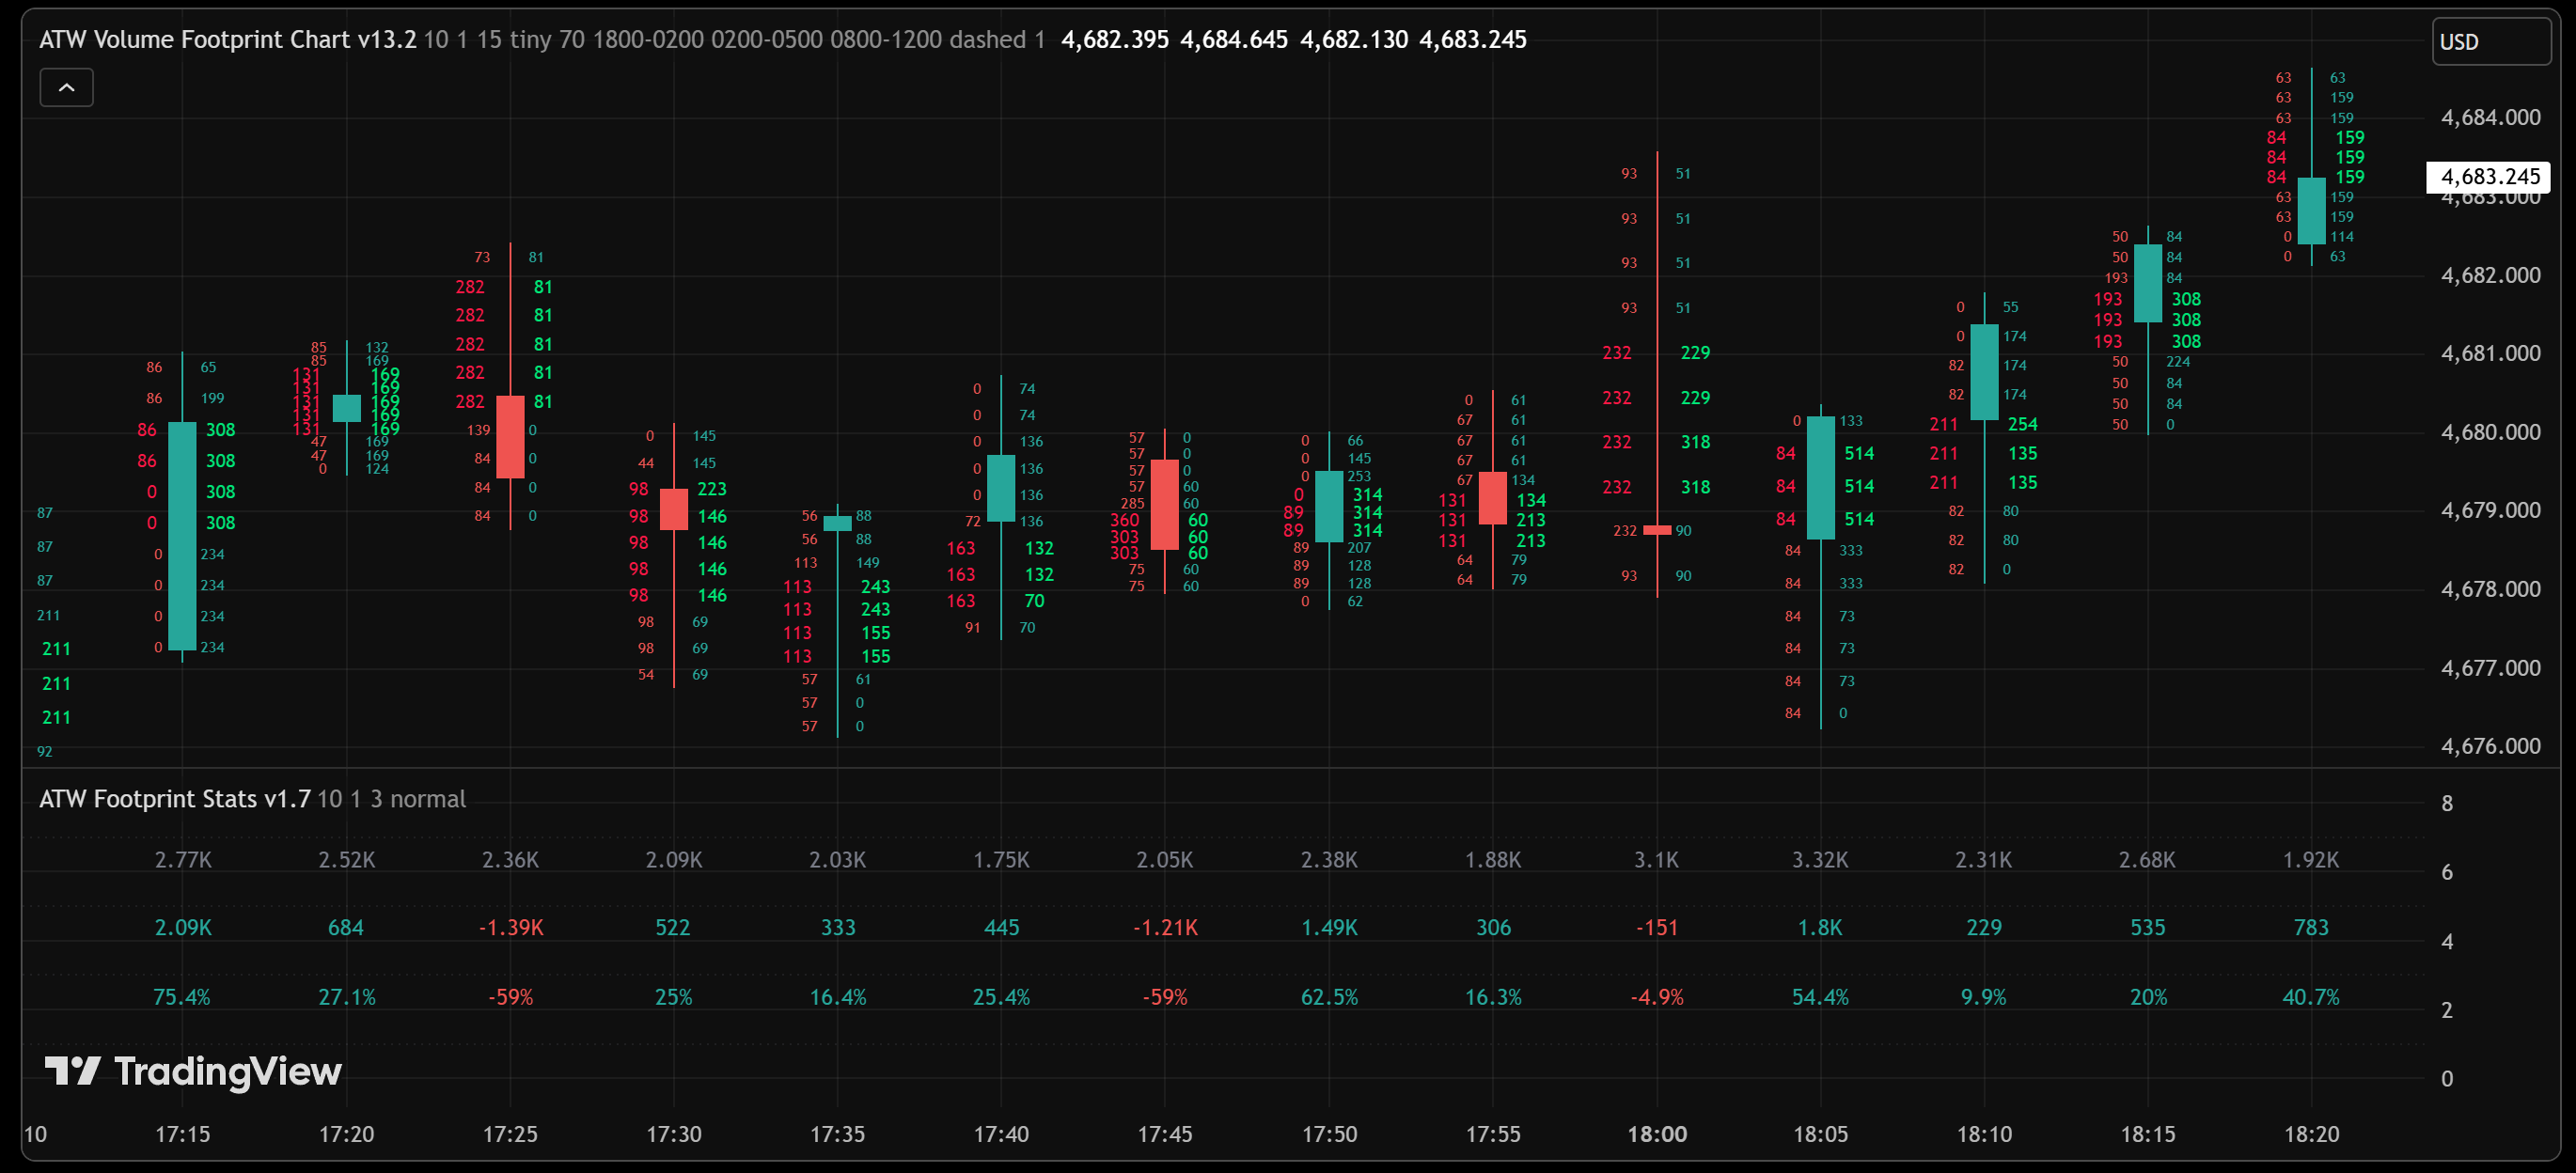
Two powerful tools in one subscription: the Volume Footprint Chart and Footprint Stats panel.
See bid and ask volume at every price level within each candle. Identify where large orders were executed and spot absorption zones.
Total volume, net delta, and buy/sell percentage for each candle displayed in a clean stats panel below the chart.
Clean visual signals with adjustable transparency for buy/sell entries. Automatic display of entry price, stop loss, and take profit levels.
Built-in RSI-based filtering prevents unreliable setups in overbought or oversold conditions, reducing false signals.
Automatically filters out indecision candles to reduce noise and false signals from low-conviction price action.
Set up TradingView alerts for valid trade opportunities. Get notified instantly so you never miss a setup.
Real screenshots from the ATW Market Depth Indicator running on TradingView.
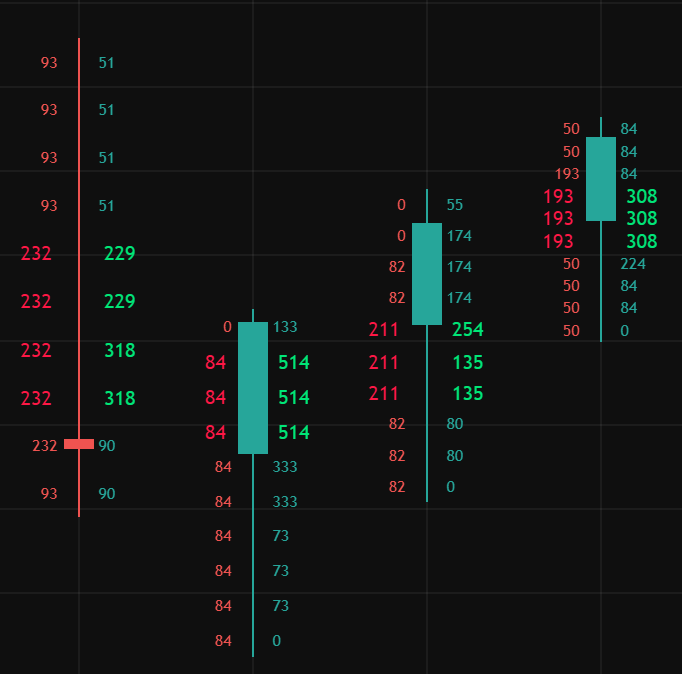
Bid/ask volume detail at every price level
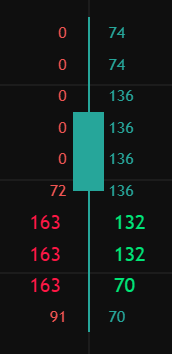
Volume distribution within a single candle
Whether you're scalping 1-minute charts or swing trading daily timeframes, market depth gives you an edge.
Read intraday order flow to time entries and exits with precision on lower timeframes.
Spot volume imbalances and absorption in real-time to catch quick moves before they happen.
Bring institutional-grade footprint analysis to TradingView without expensive standalone platforms.
Use footprint data to confirm key support/resistance levels and validate higher-timeframe setups.
Try it free for 30 days. Cancel anytime if it's not for you.
Cancel anytime. No questions asked.
Everything you need to know before getting started.
Start your 30-day free trial and experience the difference institutional-grade volume analysis makes to your trading.
Start Your Free Trial Now